 DepUnPr
Matita
published on
by  fabrixxm
· source
· tagged with
#collectd,
#dashboard,
#eng,
#javascript,
#php and
#rrd
fabrixxm
· source
· tagged with
#collectd,
#dashboard,
#eng,
#javascript,
#php and
#rrd
My “homelab” at home is made up by one (1) raspberry-pi 4 which runs some services, like pi-hole, wireguard, mpd, etc etc.
It is also running collectd to “gathers metrics from various sources” (as they say). This data is stored in RRD files, for the ease of config.
May moons ago I wrote a bash script which, via the magic incantations of rrdtool graph, generated some graphs (you can read about that in this post)
Everything was nice, I was happy, my raspberry was happy. Then one sad day, someone® deleted by accident the script. The script that generated all the nice graphs. The script of which there was no other copy around.
I was at a crossroad: rewrite the script or start a new Unnecessary Project? After a quick meeting with the Department Council, a decision was reached: start a new project, obviously. This is the Department of Unnecessary Projects, after all!
This is (more or less) the true story of how Matita was born.
Matita is a dynamic dasboard for collectd/rrd. A php file serves some API to manipulate graph configurations and the data fetched from RRD to populate those graph.
An ugly html/css/js combination uses these API to show those graps on a page (using Chart.js), automatically update the data, and handle some UI to edit the graphs.
Without leaving the webpage is it possible to add, edit and remove graphs, define which data is shown and how.
There are some bugs still (eh), but it works enough well for me.
Some screenshots:
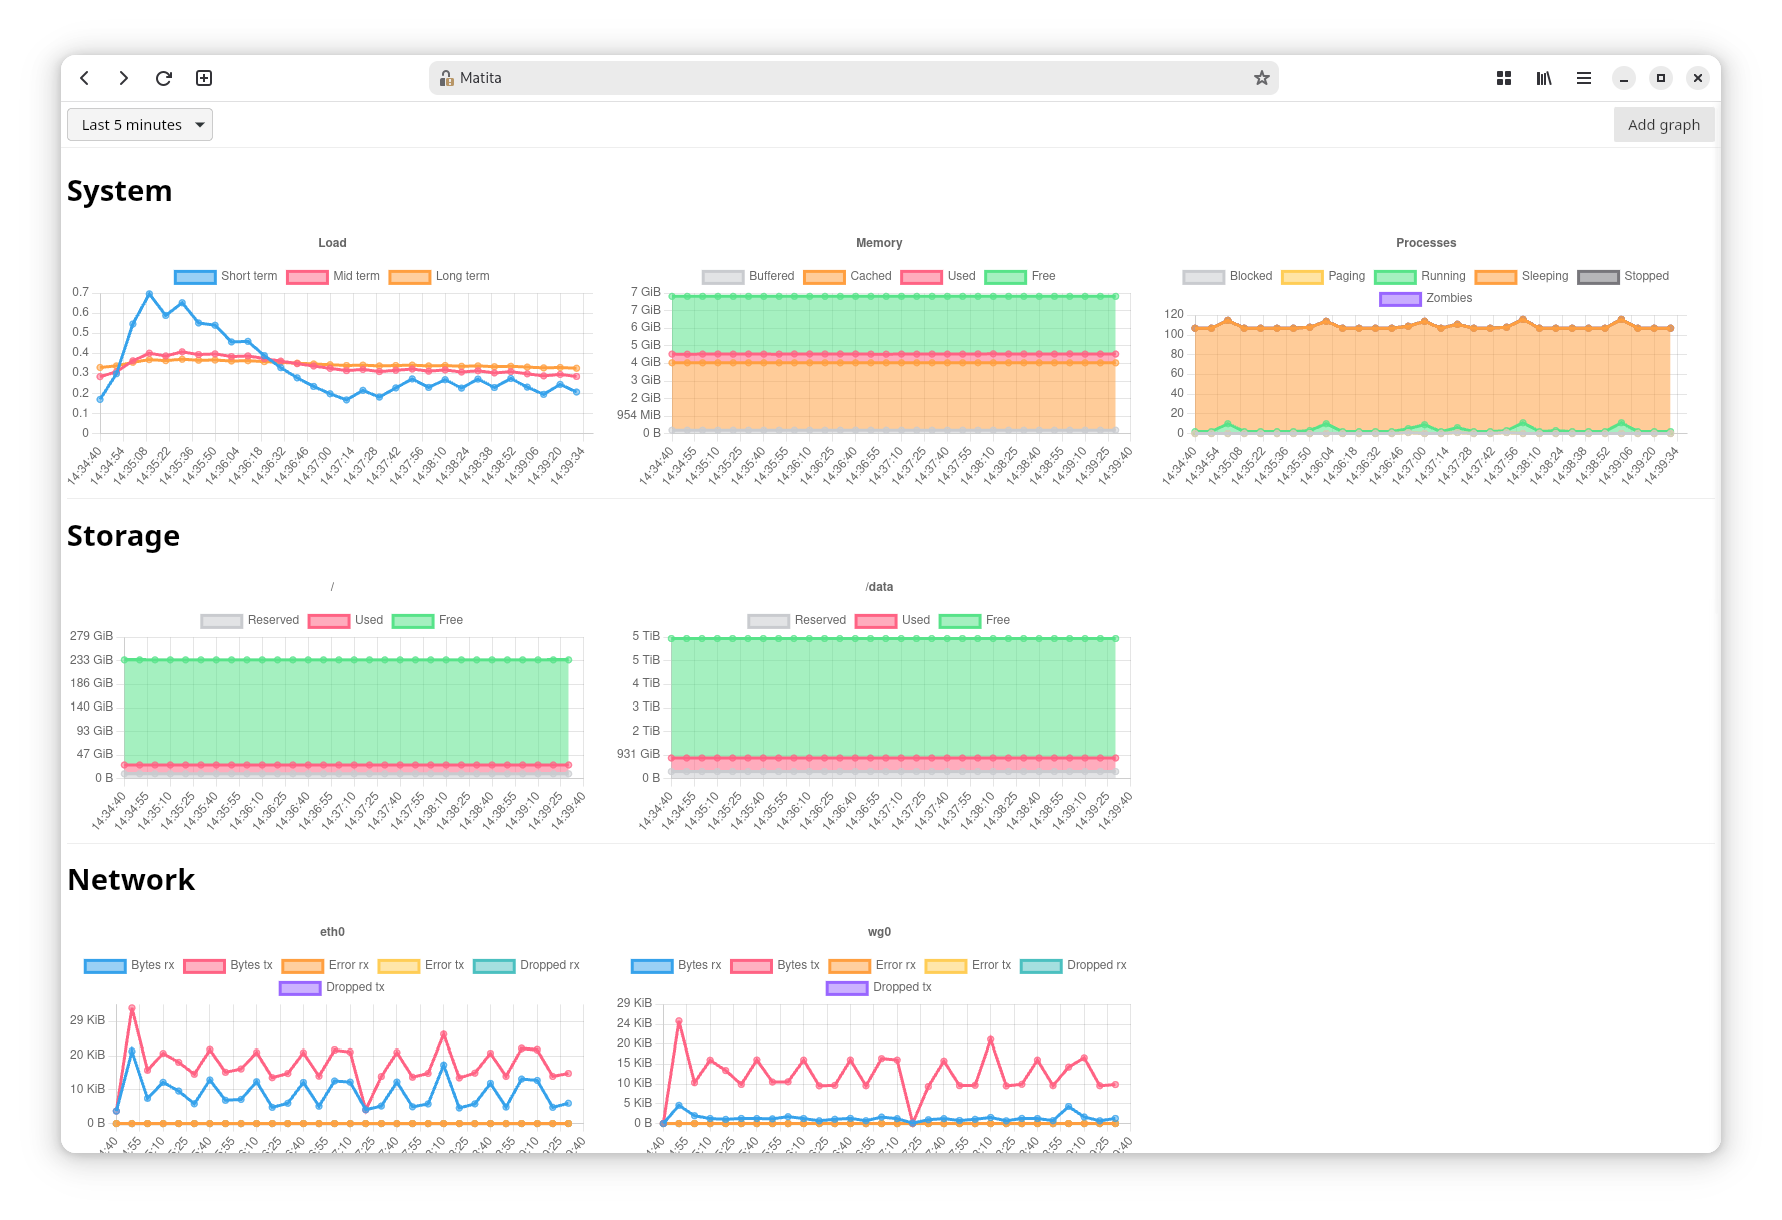 - Matita showing a dashboard
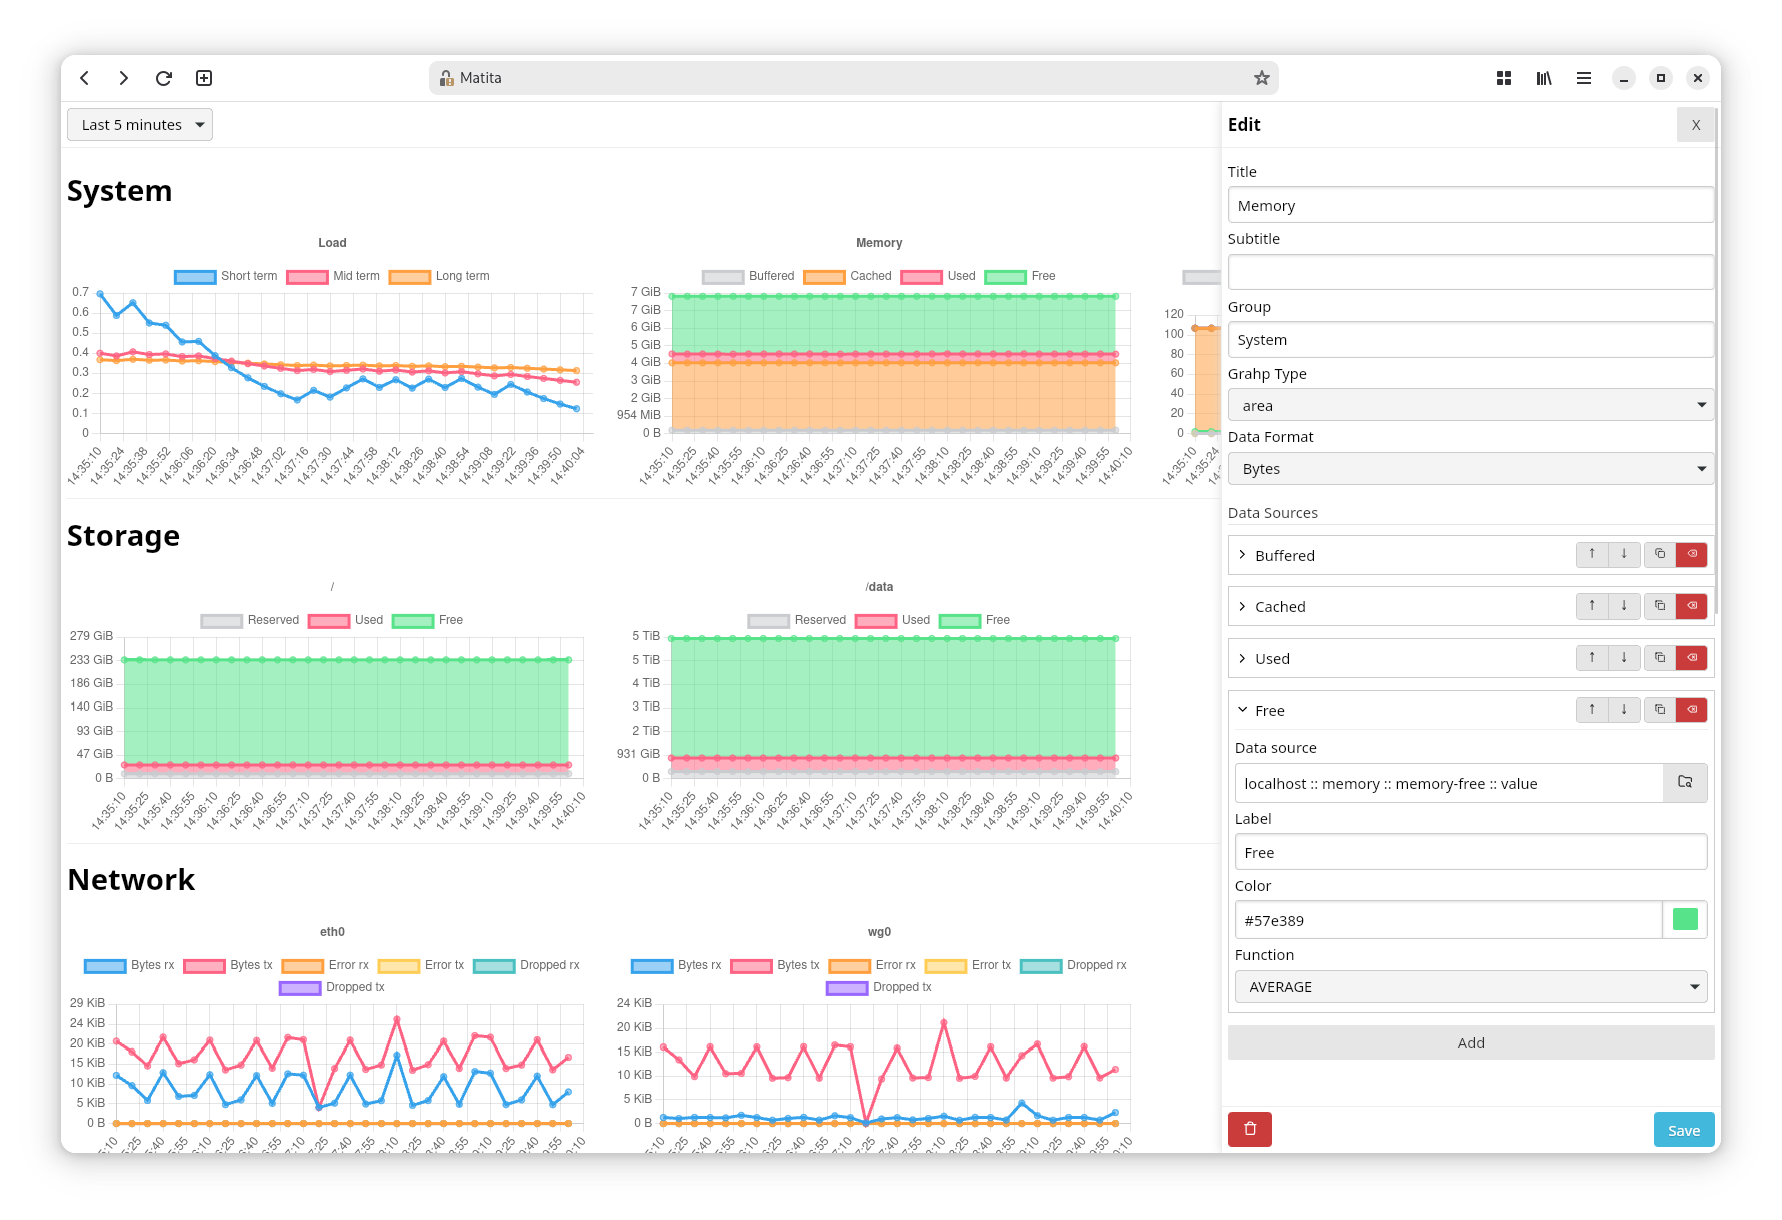 - Editing the “Memory” graph
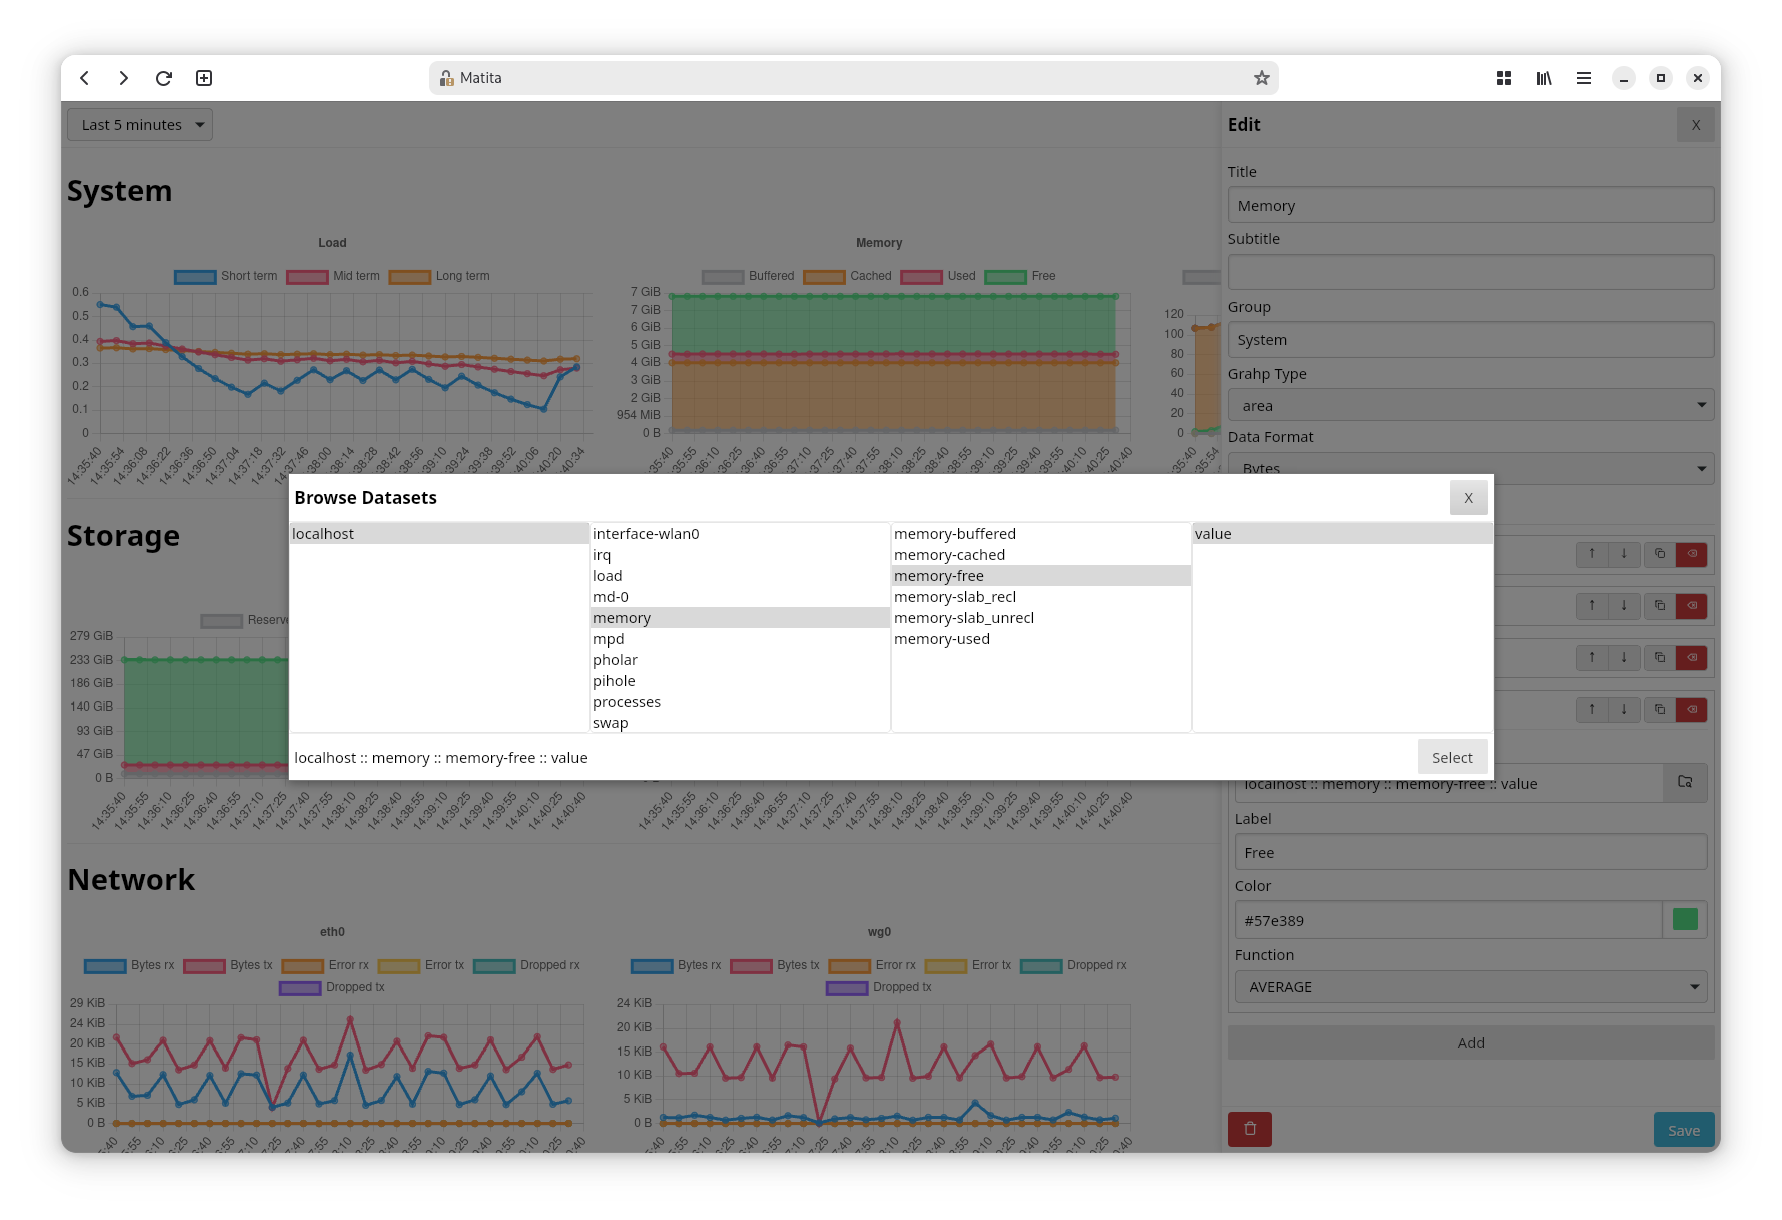 - The Dataset Browser. Remind you of anything?
Webmentions
mentions